AI Share of Voice tells you if you appear. Topical Presence tells you what for.
Superlines tracks how strongly AI models connect your brand to the commercial topics buyers ask about — across every major AI engine, with real query data.
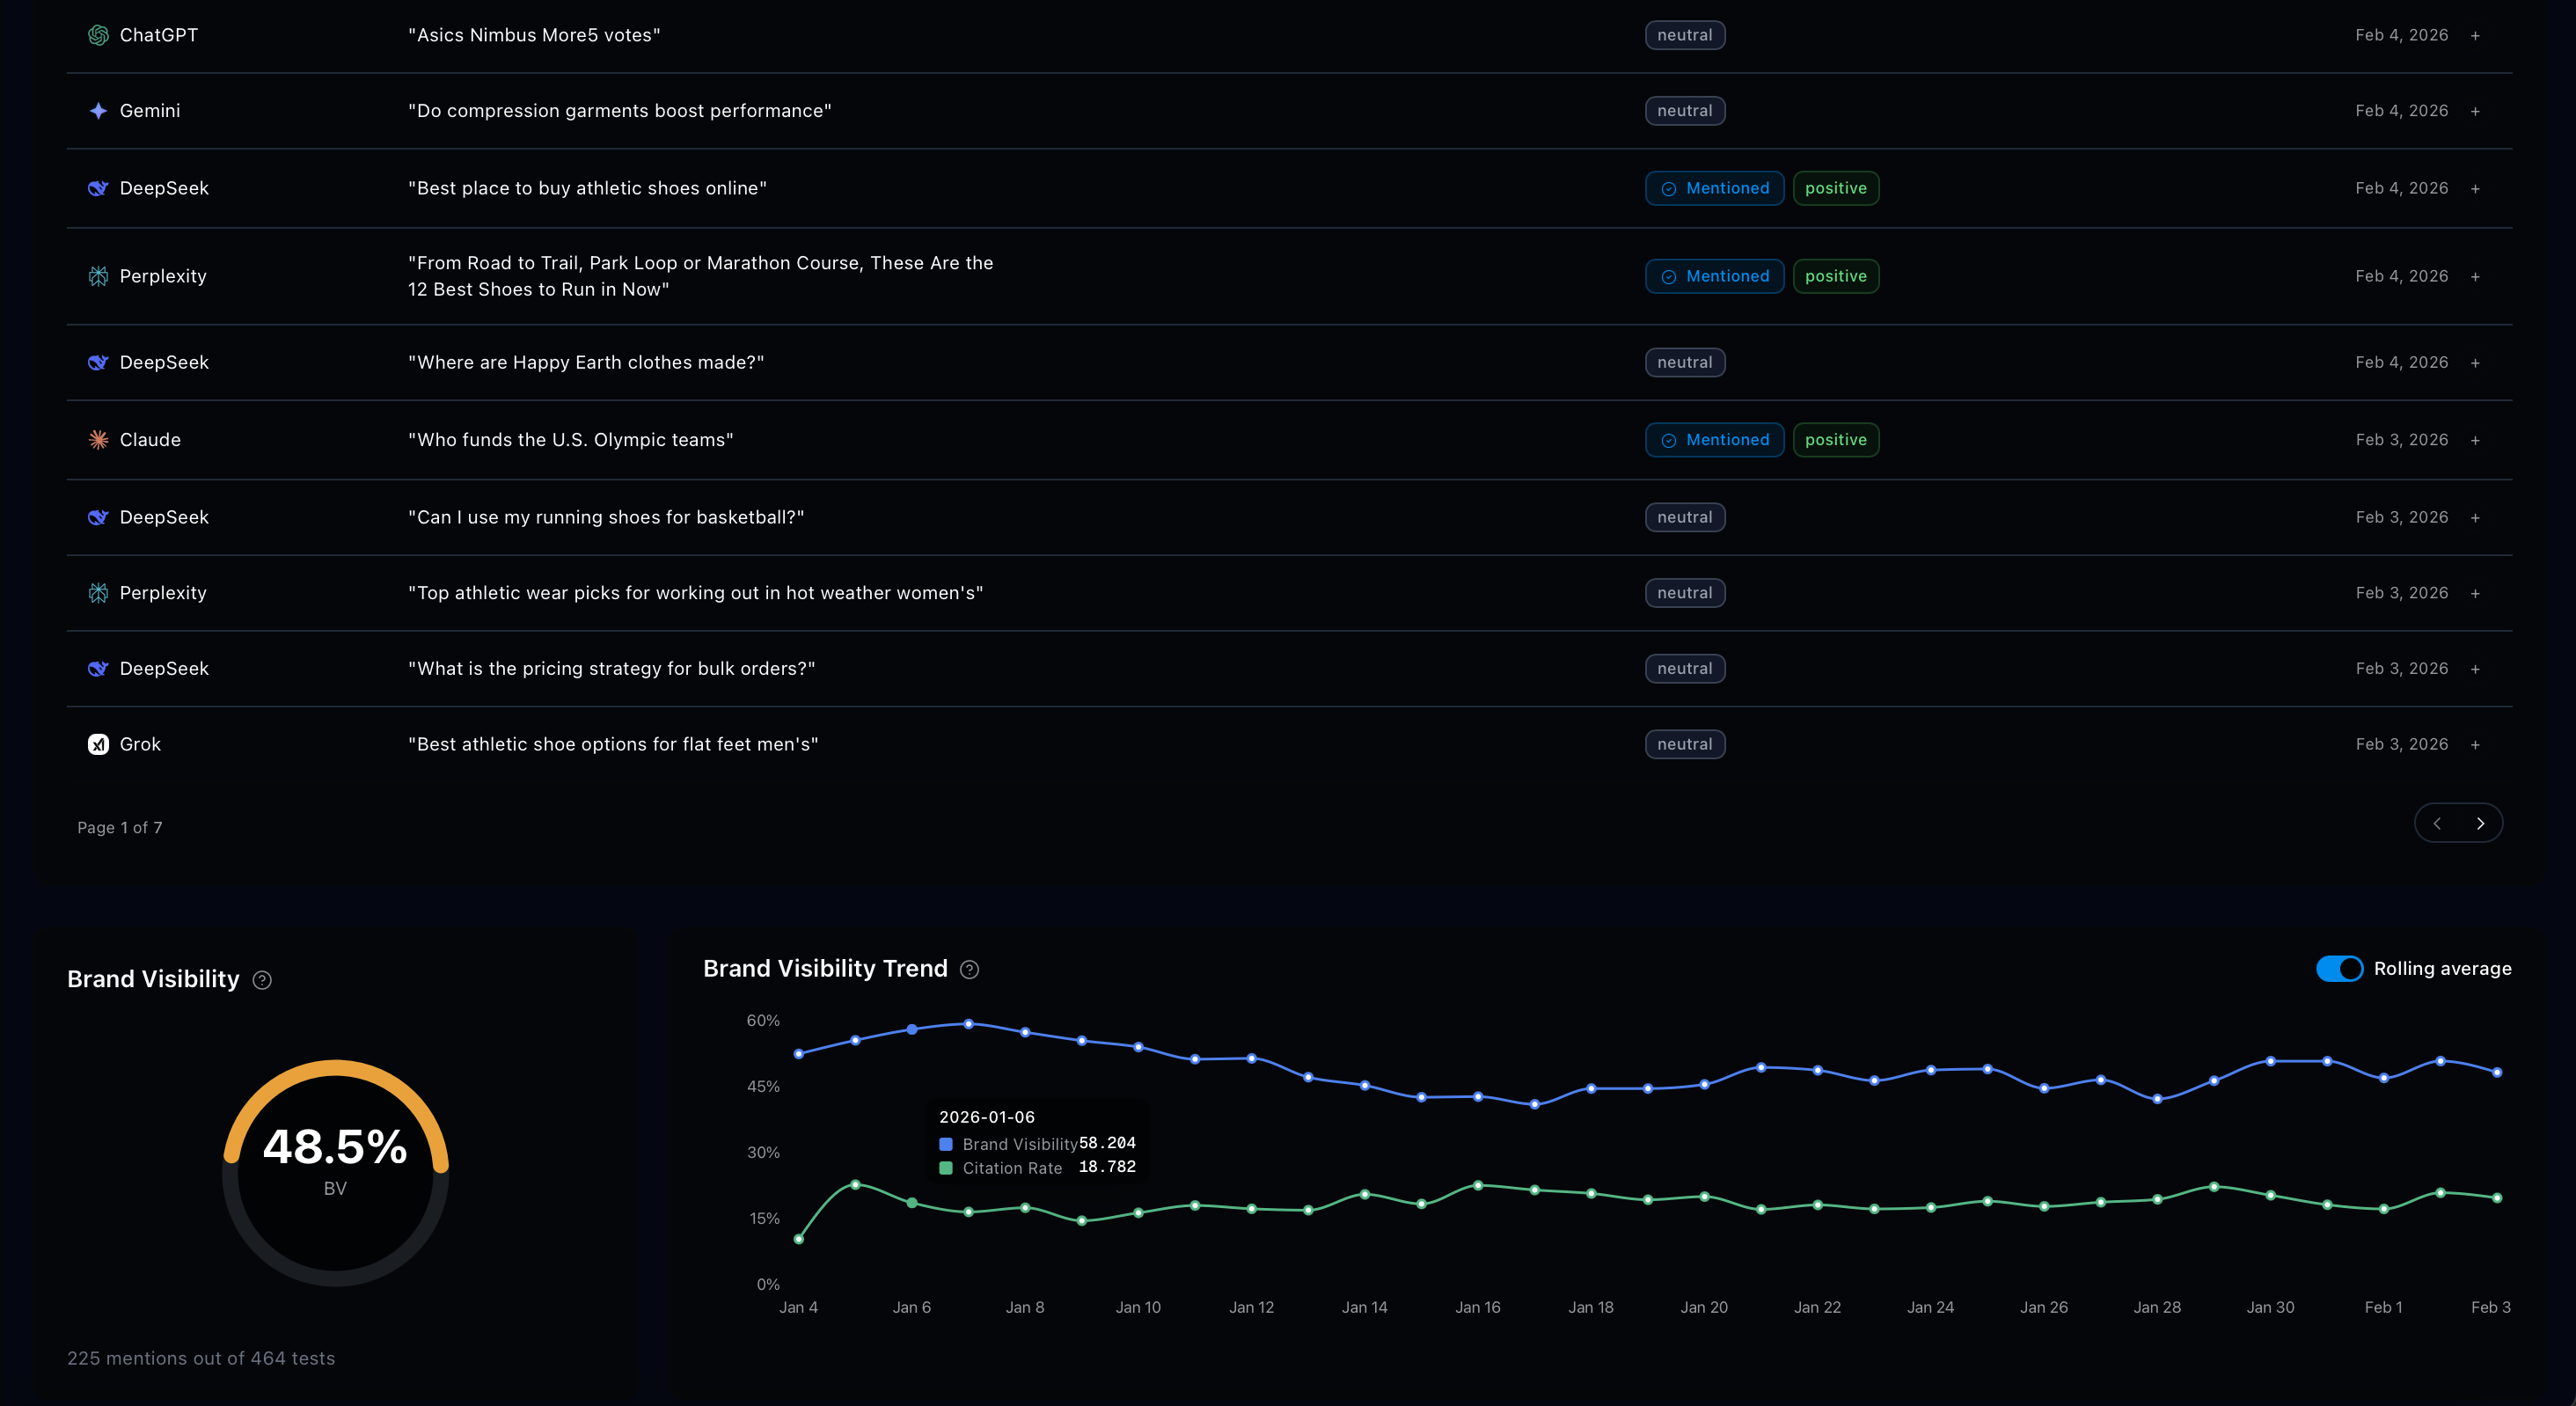
Measuring topical associations across


SOV without topic context is an incomplete signal
AI models don't rank pages — they build associations between brands and topics during training. Two brands can have identical Share of Voice for completely different reasons.
Concentrated in 3 topics. Invisible on everything else — integrations, onboarding, pricing, security.
Associated across 14 topics. Shows up wherever buyers are asking, not just the core three.
Without knowing what you appear for, you can't direct effort at the right gaps. SOV tells you the score; Topical Presence tells you the game.
Three dimensions. One composite score.
Topical Presence is a composite metric that captures not just how often you appear, but how meaningfully and how broadly your brand is associated with the commercial topics in your market.
Depth
Weighted topic strength
How strongly AI models connect you to key topics, weighted by each topic's commercial importance. High depth means you dominate the conversations that drive purchase decisions.
Tells you if you own the topics that matter most — not just the long tail.
Breadth
Topic coverage ratio
How many of the core commercial topics in your market you're associated with across AI engines. Breadth determines whether you appear across the full range of buyer queries.
Low breadth means competitors are answering questions you're invisible for.
Concentration Risk
HHI-based distribution score
How unevenly your visibility is distributed across topics, calculated using the Herfindahl–Hirschman Index. High concentration means one model update could wipe out your presence.
Fragility indicator — a single algorithm shift shouldn't be able to erase you.
Composite formula
TP = (0.45 × Depth + 0.40 × Breadth − 0.15 × Concentration) × 100
Depth carries the most weight because topic strength in high-intent queries has the most direct effect on buying decisions. Concentration is subtracted — fragility is a liability, not a neutral state.
Everything you need to act on topical gaps
Superlines gives you the data layer. Your team decides the strategy.
AI Competitive Map
Every brand in your market plotted on a Topical Presence vs. Share of Voice matrix. Instantly identify Leaders, Hidden Experts, Hollow Presences, and Marginal players.
Topic Coverage Table
Every topic cluster in your tracked prompt set — where you rank, where you're absent, and which competitors dominate the topics you should own.
Score Cards
Your Depth, Breadth, Concentration Risk, and overall TP score in one view. Track changes over time as your content and AI associations evolve.
Gap Alerts
Topics where you're unranked or outside the top 3, surfaced automatically. No manual audit needed to find your biggest blind spots.
Export
CSV and JSON for reporting, board decks, or feeding into your own data stack.
Leaders
High SOV + High TP — the benchmark to beat
Hidden Experts
Low SOV + High TP — broad topics, low raw volume
Hollow Presence
High SOV + Low TP — frequent but narrow
Marginal
Low SOV + Low TP — limited AI presence overall
What your score means
TP scores run 0–100. The ranges below reflect observed distributions across the markets Superlines currently tracks.
A gap in your score has three possible causes
Superlines identifies which topics have gaps. Diagnosing the root cause determines the right response — content alone isn't always the answer.
Product gap
You don't cover the capability. Content won't fix this — it requires a product or positioning decision first.
Documentation gap
You have the product, but AI engines can't associate it with you. The solution is systematic, structured content that builds the association.
Content depth gap
It's documented, but coverage is too thin for the AI to build a confident association. The signal exists; it just needs amplification.
Find out which topics your brand is invisible for
Before your competitors do. Set up Topical Presence tracking in minutes with real AI query data.
7-day free trial · Cancel anytime